Why Basic Momentum and Mean Reversion Don't Work Anymore
I tested momentum and mean reversion strategies obsessively for 4 months. The results:
| Strategy | Backtest | Out-of-Sample | Trades | Max Drawdown |
|---|---|---|---|---|
| Cross-Sectional Momentum | 37.24% | 3.02% | ~50 | -20% |
| Dual Momentum | 77.1% | 9.01% | 28 | -53% |
| RSI Mean Reversion (Crypto) | 173% | 55.14% | 2 | N/A |
| RSI Mean Reversion (Stocks) | 150.4% | N/A | 7 | -7.5% |
The pattern: Strategies look amazing in backtests, then collapse when tested on new data. Cross-sectional momentum dropped 92% in performance. Dual momentum would have you stomach a 53% drawdown for 9% returns. Mean reversion only generated 2-7 trades across years of data - not enough to trust.
The lesson: If you're trading these strategies because a book or YouTube video told you they work, you're trading on faith, not evidence.
The Journey
Every trader discovers momentum and mean reversion at some point. They're in every trading book, every course, every YouTube video claiming to reveal "the secret the pros use."
The logic is compelling. Momentum says winners keep winning - buy what's going up, sell what's going down. Mean reversion says prices swing too far and snap back - buy when fear is extreme, sell when greed takes over. Both strategies have decades of academic research "proving" they work.
I believed it too. So I did what any obsessive engineer would do: I tested it systematically. I wrote thousands of lines of code, built an evaluation framework, and ran backtests until my computer begged for mercy.
My git commit history tells the story better than I could:
August 21: "Complete momentum surge: failure"
August 21: "Cross sectional momentum: failure" (4,537 lines of code, deleted)
August 21: "Cross sectional momentum: failed"
October 15: "Death of cross-sectional momentum birth of h4rn355"
November 2: "Another strategy down the toilet"
November 25: "Remove dual momentum"
December 1: "Make h4rn355 show me how wrong I am"
That last commit message is my favorite. After months of work, I built a testing framework specifically designed to prove my strategies didn't work. Spoiler: it succeeded.
What follows is a detailed autopsy of each strategy - what the numbers promised, what they actually delivered, and why the gap between them should terrify anyone trading these approaches with real money.
Mean Reversion: The Beautiful Theory
RSI mean reversion is seductive. The core equation is elegant:
RSI = 100 - (100 / (1 + RS))
where RS = Average Gain / Average Loss over N periods
When RSI drops below 35, an asset is "oversold" - price has fallen too far too fast, and a bounce is coming. Combined with Bollinger Bands for confirmation:
# From rsi_mean_reversion.py
data["momentum_rsi"] = ta.momentum.rsi(data["close"], window=14)
data["lower_band"] = data["sma_20"] - (data["vol_std"] * 2)

# Buy when oversold AND price below lower band
conditions = [
    (data["momentum_rsi"] < rsi_lower) & (data["close"] < data["lower_band"]),
    (data["momentum_rsi"] > rsi_upper) & (data["close"] > data["upper_band"]),
]
signals = [1, -1]  # 1 = buy, -1 = sell
data["signal"] = np.select(conditions, signals, default=0)
When I first ran my backtests, I thought I'd found gold:
- LINK/USD: 173% return, 4.39 Sharpe ratio, 100% win rate
- META: 164.6% return, 3.77 Sharpe ratio
These numbers are absurd. A 4.39 Sharpe ratio would make you the greatest trader in history. I was ready to quit my job.
Then I looked at the trade count: 3-4 trades each.
That's not a strategy. That's a coin flip that happened to land heads.
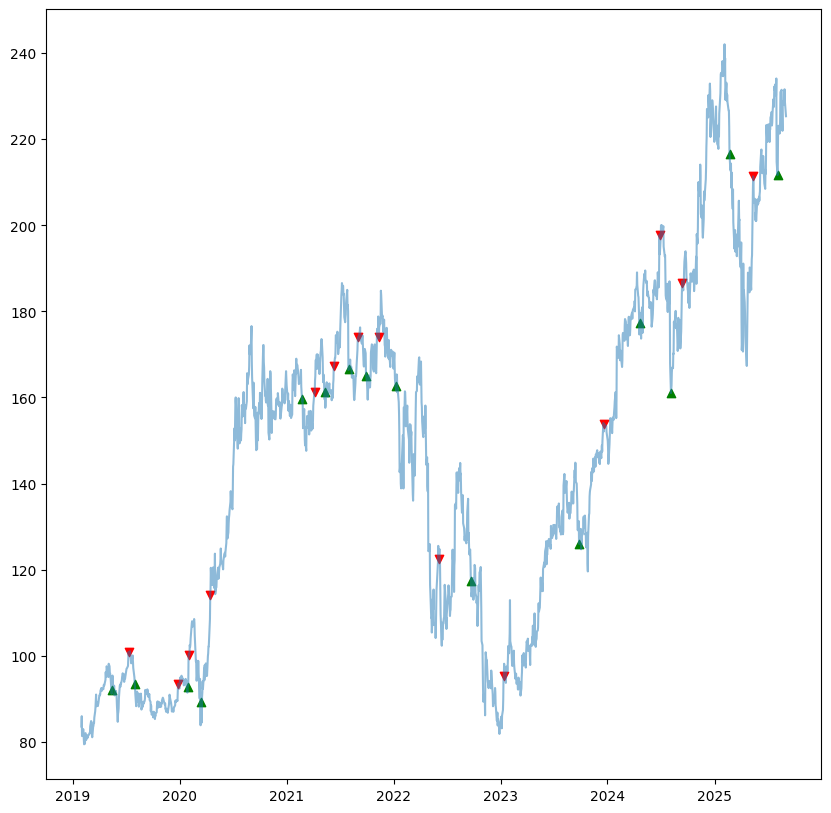
Mean reversion buy/sell signals over 6 years. Count the triangles - that's your entire sample size.
The Out-of-Sample Reality Check
Here's what most traders never learn: backtesting on data you've already seen proves nothing. Your strategy could be curve-fit to historical noise. The only way to know if you have edge is to test on data your strategy has never seen before.
So I built a proper testing pipeline. I trained on historical data, then tested on completely fresh periods the strategy had never touched.
The results were sobering:
META (stocks): 7 total trades across an entire year of data
LINK (crypto): 2 trades across 2+ years of data
LINK's 55.14% return sounds impressive until you realize it came from exactly two trades. That's not statistical evidence - that's luck.
The fundamental problem is that "extreme oversold" conditions are rare by definition. RSI < 35 happens maybe 1-2 times per quarter. You need at least 30 trades to have any statistical confidence in a strategy. At this rate, you'd need 15+ years of data just to validate whether the approach works.
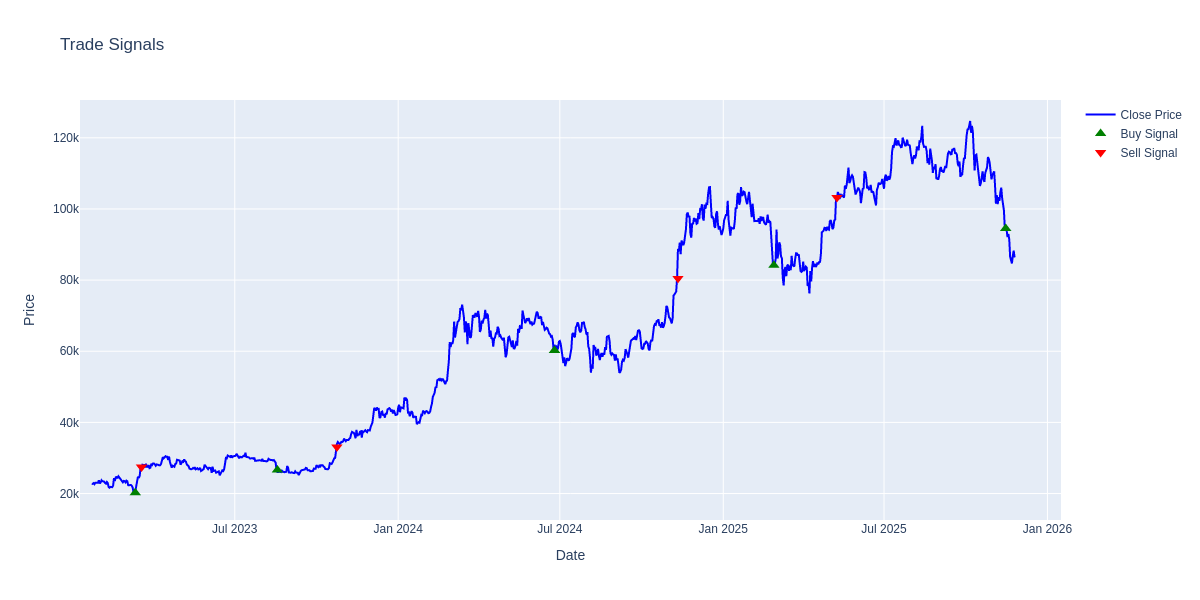
BTC daily chart with RSI mean reversion signals. Three years of data, maybe 6 trades. This is the signal scarcity problem in action.
Cross-Sectional Momentum: The Academic Darling
Cross-sectional momentum is the strategy that launched a thousand PhD dissertations. The core idea: rank stocks by past returns, buy winners, sell losers.
# From momentum_calculator.py - base factor weights
self.base_weights = {
    'mom_1m': 0.11,   # Recent momentum (11%)
    'mom_3m': 0.18,   # Short-term momentum (18%)
    'mom_6m': 0.16,   # Medium-term momentum (16%)
    'mom_12m': 0.13,  # Long-term momentum (13%)
    'pe_ratio': 0.09, # Value factor
    'roe': 0.06,      # Quality factor
    # ... more factors totaling 100%
}
Rank all stocks by composite score, go long the top decile. The calculation itself:
# Calculate returns for different periods
returns_3m = monthly_prices.pct_change(3)
returns_6m = monthly_prices.pct_change(6)
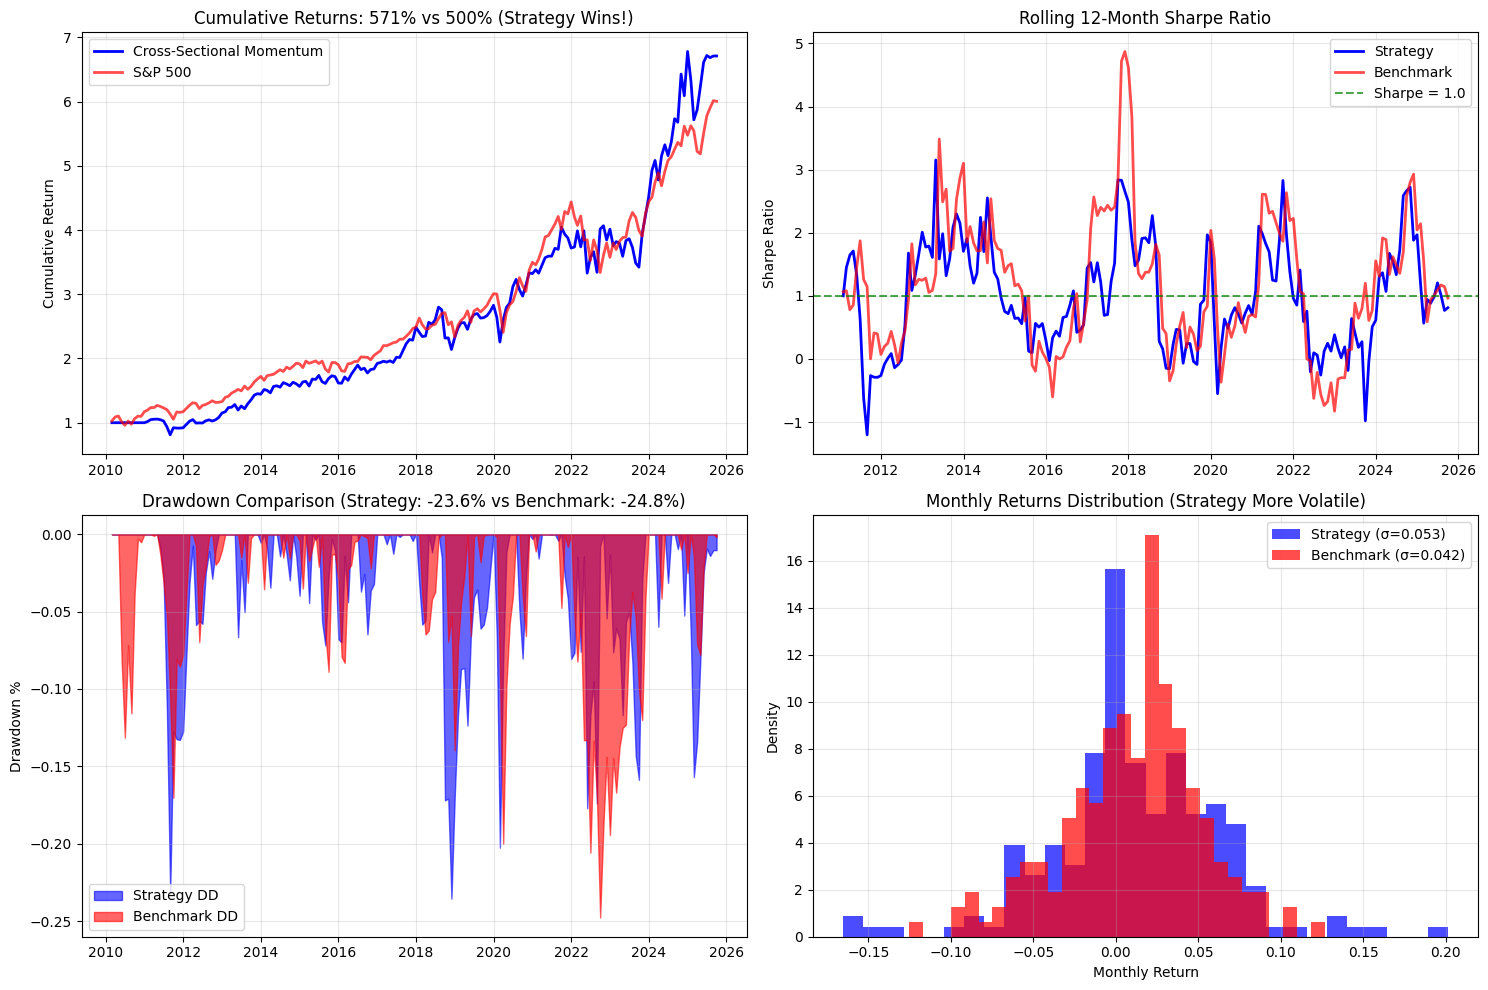
returns_12m = monthly_prices.pct_change(12)With monthly rebalancing and sector neutrality constraints, traditional backtest results looked solid: 37.24% total return (13.04% annualized).
The seductive backtest: "Strategy Wins!" with 571% cumulative returns. Sharpe ratio looks great. Drawdowns seem manageable. This is what overfitting looks like.
Out-of-sample results: 3.02% total return (4.07% annualized).
That's a 92% performance drop when tested on new data.
It gets worse:
- Only 42.9% of test periods were profitable
- 6 out of 14 periods had 0% returns (complete failures)
- 4 out of 14 periods had negative returns
- Statistical tests showed the results were not different from random
Let me repeat that: one of the most academically validated strategies in finance, when tested properly, was statistically indistinguishable from random noise.
Dual Momentum: The Second Try
After cross-sectional momentum failed, I tried Gary Antonacci's dual momentum - a simpler variant. The logic combines relative and absolute momentum:
# From strategy.py - dual momentum signal calculation
lookback_trading_days = momentum_lookback_period * 21  # ~21 trading days/month

for symbol in available_symbols:
    current_price = symbol_prices.iloc[-1]
    past_price = symbol_prices.iloc[-lookback_trading_days]
    momentum = (current_price / past_price) - 1
    momentum_scores[symbol] = momentum

# Find best performer in universe
best_asset = universe_momentum.idxmax()
best_momentum = universe_momentum.max()

# Compare against risk-free asset (bonds)
if best_momentum > risk_free_momentum:
    final_signals[best_asset] = best_momentum  # BUY winner
else:
    final_signals = 0  # HOLD cash - absolute momentum filter
Backtest: 77.1% return. Still promising.
Out-of-sample: 9.01% average return across 28 test periods.
But here's the number that killed it: -53.08% maximum drawdown.
Would you accept a strategy that could lose half your account to earn 9%? You could get 5% from Treasury bonds without the ulcers.
The Sharpe ratio was 0.375 - which means you're barely being compensated for the risk you're taking. At that ratio, you'd need leverage to make meaningful returns, which would amplify that 53% drawdown into account destruction.
On November 25th, I committed "Remove dual momentum" and deleted thousands of lines of code.
Two momentum strategies down. Thousands of hours invested. Zero viable approaches to show for it.
Why These Strategies Are Dead
After 4 months of testing, three patterns emerged that explain why textbook strategies fail in practice.
The Signal Scarcity Problem
Mean reversion strategies wait for extreme conditions. By definition, extreme conditions are rare. RSI < 35 happens maybe 1-2 times per quarter. To have statistical confidence in any strategy, you need at least 30 trades. At 4-8 trades per year, you'd need almost a decade of data just to validate whether your approach works - and by then, market conditions have changed completely.
The math simply doesn't work for retail traders with limited capital and time.
Market Regime Mismatch
Mean reversion thrives in range-bound, choppy markets. Momentum thrives in trending markets. The problem? 2024 was neither.
SPY was up 20%+. Bitcoin was up 100%+. NVDA went parabolic. These were trending markets that punished mean reversion (buying dips that kept dipping) and punished momentum (the trends were too fast for monthly rebalancing to capture).
Strategies designed for one market regime get destroyed in another, and you never know which regime you're in until it's too late.
What Worked in Backtests Doesn't Survive New Data
This is the hardest pill to swallow. When you optimize a strategy on historical data, you're not finding patterns - you're fitting noise. The more parameters you tune, the better your backtest looks, and the worse your live performance will be.
My cross-sectional momentum strategy had a 37% backtest return and a 3% out-of-sample return. That gap isn't implementation error. It's overfitting.
The Uncomfortable Truth
After all this failure, I tried something different.
Instead of waiting for rare signals that might indicate a reversal, I explored approaches that generate daily predictions. Instead of rules-based systems that can't adapt, I tested models that learn patterns from data.
Simple models with aggressive regularization showed promise where traditional technical analysis failed.
I'm not ready to share exactly what worked - that's for a future post, and frankly the results need more validation. But I will say this: the solution wasn't a better momentum indicator or a more refined RSI threshold. It was accepting that the strategies retail traders learn about are the strategies that have been arbitraged away.
What You Should Take Away
1. Backtest results without out-of-sample testing are meaningless. Any strategy can look good on historical data if you tune enough parameters. My cross-sectional momentum had a beautiful 37% backtest return - and a pathetic 3% when tested on new data. The only results that matter are on data your strategy has never seen.
2. Signal frequency matters as much as win rate. A 100% win rate across 3 trades isn't a strategy - it's luck. You need dozens of trades to have any statistical confidence that your edge is real. Most mean reversion strategies generate maybe 4-8 signals per year - nowhere near enough to know if you're skilled or lucky.
3. The strategies in books were arbitraged away years ago. If a strategy is well-documented enough to be in a bestselling book or a popular YouTube video, thousands of traders have already tried it. The edge, if it ever existed, is gone. By the time a strategy becomes "common knowledge," it's already priced in.
4. Drawdowns matter more than returns. Dual momentum's 9% return sounds okay until you realize you might lose half your account getting there. Can you really hold through a 53% drawdown without panic selling at the bottom? Most people can't, which means they lock in losses at the worst possible time.
5. Market regimes change, and strategies don't adapt. A strategy optimized for one market environment will likely fail in another. 2024 was a trending bull market that punished mean reversion and was too fast for monthly momentum rebalancing to capture. By the time you know the regime has changed, your account has already paid the price.
Closing Thoughts
I spent 4 months, wrote thousands of lines of code, tested over 14,000 parameter combinations, and had to accept that everything I thought I knew about trading strategies was wrong.
I'm not saying alpha doesn't exist. Markets aren't perfectly efficient, and there are traders who consistently beat benchmarks.
But I am saying alpha isn't where the textbooks told you to look. The strategies that get taught in courses and promoted on social media are exactly the strategies that retail traders have been losing money on for decades.
If you're still trading momentum or mean reversion because someone on the internet told you it works, I hope this post gives you pause. Test your strategies. Test them properly. And when they fail - because they probably will - be willing to try something different.
My git history is littered with deleted strategies and commit messages like "Another one down the toilet." That's not failure. That's the scientific method.
The real failure would have been trading these strategies with real money without ever testing them properly.
The strategies that actually work are out there somewhere. They're just not the ones being sold in courses and promoted in YouTube thumbnails. Finding them requires rigorous testing, uncomfortable truths, and a willingness to delete a lot of code.
I'm still searching. The difference is now I know what I'm looking for.
This analysis is based on real trading system development. Numbers come from actual backtests and out-of-sample testing, not hypotheticals.
Tested: 14,000+ parameter combinations across momentum and mean reversion strategies
Duration: 4 months
Lines of code written and deleted: 10,000+
Current status: Still searching for what actually works